Recently we added a display to the Reflection Table highlighting three examples of how systemic racism impacts communities in our borough of Croydon.
The exhibit titled “To fight hunger, to fight poverty, you have to fight systemic racism”, features two dolls – one white, one black. They were holding a 3 page flip book, speech bubbles on each page highlighting how different aspects of poverty impacts each child.
Life Expectancy
The first page looks at life expectancy, how living in a predominantly black/asian area of our borough cut your life expectancy by over 10 years compared to living in a predominantly white area just a mile a half up the road:
WHITE CHILD:
My family lives in a majority white area of Croydon, my life expectancy is 84.5 years.
(Selsdon, 80% white, 19% black/asian)
BLACK CHILD:
My family lives 1.6 miles away in a majority black/asian area of Croydon, I will live 10 years less, my life expectancy is 74.1 years.
(Selhurst, 26% white, 65.5% black/asian)
Child Poverty
The second page looks at child poverty which impacts children in black/asian/ethnic minority families 2.3x more than children in white families:
WHITE CHILD:
1 in 5 white children live in poverty in London (20%)
BLACK CHILD:
Nearly 1 in 2 ethnic minority children live in poverty in London (46%)
Homelessness
The third page focuses on homelessness – a non-white family is 3x more likely to be made homeless than a white family.
WHITE CHILD:
In Croydon, 1 out of every 4 families being made homeless or threatened with homelessness is white.
BLACK CHILD:
In Croydon, 3 out of every 4 families being made homeless or threatened with homelessness is non-white.
Source
Life Expectancy:
https://www.ons.gov.uk/peoplepopulationandcommunity/healthandsocialcare/healthandlifeexpectancies/datasets/lifeexpectancyestimatesallagesuk
- Child Poverty:
https://endchildpoverty.org.uk/wp-content/uploads/2023/06/Local-indicators-of-child-poverty-after-housing-costs_Final-Report-3.pdf
Homelessness:
26% of those threatened with homelessness ( owed prevention duty) or homeless ( owed relief duty) in Croydon are white families.
Department for Levelling up, housing & communities, statutory homelessness: detailed local authority-level tables Oct – Dec 2022 (revised 25 July 2023)
- 2021 Census – Ethnic composition
London: Asian (20.7%) Black (13.5%) Mixed (5.7%) White (53.8%) Other (6.3%)
Croydon: Asian (17.5%) Black (22.6%) Mixed (7.6%) White (48.4%) Other (3.9%)
Other Interesting Posts:
“Let my best teacher see my painting” – 6 year old writes to HMP Bronzefield
Unjustly Imprisoned For Two Months – #Filton10 Day 60
Children send paintings to their “best” teacher #Filton10
#Filton10 – Day 39 – Malcolm X in Gaza
Solidarity with the #Filton10
London Race Action Plan – A Serious Attempt At Anti-Racism Or Just Window Dressing?
Campaign To Abolish Reporting
Stop Rwanda Deportations
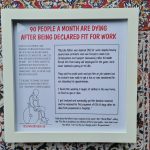
Reflection: 90 people a month are dying after being declared fit for work!
Reflection: The Rape Clause
Reflection: Abortion Of Wanted Babies
The Invisible One In Seventeen

